April showers bring May flowers and so far this May, more showers. On this rainy day in May, let’s get caught up on what has been happening year to date in the Big Bear Real Estate market. (Aside - The big news in Big Bear right now is that Highway 330, a.k.a. the ‘front road’ to Big Bear, is set to re-open way ahead of schedule. They have been letting mid-week commuter traffic through, one way only and only at specified hours, for some time now. But the road is set to open for regular use for Memorial Day weekend! Although most likely it will return to sporadic use after that while they finish up. It should be set for regular use and remain open by the big July 4th holiday.)
A few interesting statistics to point out: In April of this year the average sale price of all residential homes sold in the Big Bear Valley was $248,128, which was up 8% from April of 2010. The days-on-market overall, a good indicator of demand, decreased 9% from 123 in April of 2010 to 112 in April of this year. When looking at homes sold under $250,000, it went down 12% from 115 to 101. And in the price range of $250,000 - $500,000 it decreased 20% from 141 to 112.
The overall inventory in Big Bear on our MLS is on the rise. In January of this year there were 652 active residential listings which, based on the number of homes that were in escrow then (115) was just under a six month supply, whereas now there are 742 active residential listings, which currently equates to and 8.4 month supply. It is, however, typical for inventory to increase this time of year. The big question is: will there be a continued increase in demand to absorb all this new supply?
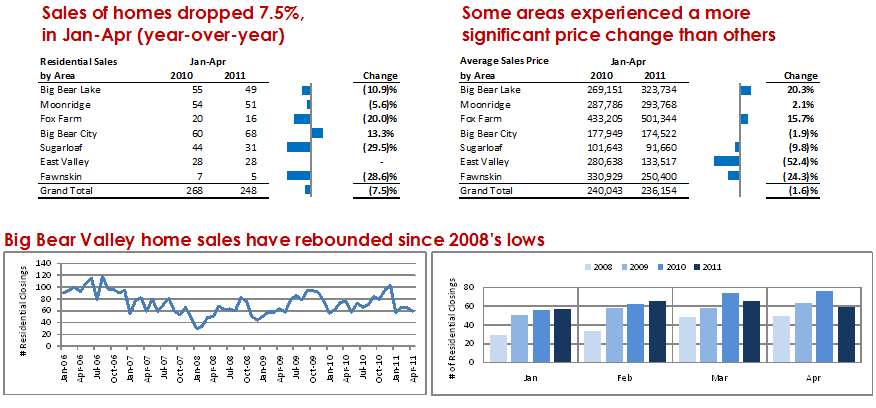
When looking at the overall trend in the number of closed transactions for the first four months of the year since 2008, a clear trend has been evident: The number of deals has steadily been on the rise. However in March and April of this year, for the first time since 2008, monthly closings did not exceed what we had seen the year prior. Overall the total number of residential closings from January through April of 2011, when compared to 2010, is off 7.5% and the change in average sales price is down 1.6%.
A few interesting side notes come to light when looking more closely by sub-area (again this is for the first four months of 2011 compared to the first four months of 2010). The number of transactions in Big Bear Lake proper was down 11% but the average price was up 20%. In Big Bear City transactions were up 13.3% and average price dropped 2%. Sugarloaf saw a 30% drop in transactions and a 9.8% drop in average price. The east valley (Baldwin Lake, Erwin Lake and Lake Williams), was flat in transactions but off a whopping 52% in average price….What we are seeing as our market continues to stabilize is that the more desirable locations, the first to typically rebound, are showing price increases and that in turn has slowed the number of transactions. Whereas on the outskirts, the number of transactions is edging up but prices are still falling.
In a time where there exists so much uncertainty, a few things are for sure for interested buyers: More choices are good, super low prices and rock bottom interest rates are good, and it is indeed an amazing time to buy the right piece of real estate here in Big Bear so let us know how we can help. We are excited to pass along the chart below which illustrates much of what was discussed and I hope you find it useful. Let me know if you would like to receive more detailed charts and market insights: We just completed an interesting study of the average dollar per sq/ft in the different areas of Big Bear as well. We always look forward to hearing from you. Until next time, all the best and happy hunting.

