October 2013 Market Update: The change of seasons is in full swing here in Big Bear. With a fresh few inches of snow on the ground this morning and Halloween fast approaching, fall is in effect and winter doesn't feel far off.
Prior to reviewing the numbers for October, I thought I would shed some light on a number we use often in describing the Big Bear real estate market – Absorption Rate – and what this number represents.
Absorption Rate: The Speed of the Market
Simply put, the Absorption Rate is the number of pending sales (homes currently in escrow), divided by the total number of active listings on the market. If the real estate market was a car, the absorption rate would describe the speed it was traveling. This simple calculation describes demand as a percentage of the overall inventory in the real estate market, as it indicates how much of what is available is actually selling. For example, if the supply was to remain constant and the market gained speed, this rate would increase. But the absorption rate is influenced by supply as well. If demand was to remain constant and a wave of new listings hit the market, the absorption rate would decrease. So, when interpreting changes in this metric it is important to understand if the change is driven by supply or demand.
Absorption Rate, Relative to Overall Market (39%)

It is also interesting to note, as described above, the differences in absorption rate in different areas and price ranges of Big Bear. These varying rates show where the market is ‘hot’ and where it is ‘not’. You can see that, relative to the overall market (39%), the price range under $250,000 is super hot (57%, or 18% over the market) and the areas of Big Bear City (50%, 11% over market) and Sugarloaf (47%, 9% over market) are also selling well.
Driven by Supply or Demand?
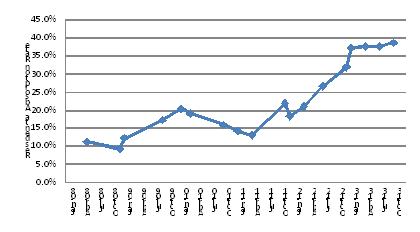
Historical Absorption Rate, Big Bear Residential Real Estate

The current absorption rate was influenced by a drop in inventory; we had 513 active residential listings on September 15th and currently have 458. However, even given this drop in supply, the absorption rate has held relatively stable, meaning that demand overall has slipped in the last month as well. In order to add a historic perspective, the graph to the right shows the absorption rate at different times going back to 2008.
As always we look forward to hearing from you with any questions you may have on the Big Bear real estate market. Your 4th quarter update, which should shed some light on how 2013 winds up, will be coming soon…Thanks.
