November 2013 Market Update: Thanks for checking in with us on the Big Bear real estate market. With Halloween behind us and Thanksgiving fast approaching, let’s take a look at what occurred in October and what that says about how 2013 might end up.
October Traded Sideways
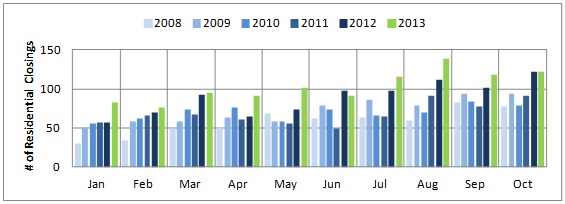
If, like me, you were looking for October to shed some light on the overall direction of the market for the fourth quarter, you will need to stay tuned, as October did not provide too much insight. When compared to October 2012, the average residential sales price in Big Bear remained basically unchanged ($236,592) and total number of residential sales (122) was flat as well. Perhaps this indicates the market is set to trade sideways for a bit? We shall see…
Big Bear Real Estate: Residential Closings

Demand Is Holding Strong
Of note, demand is certainly holding strong with our absorption rate holding at an incredible 39% (vs. 12% in 2011, see last month’s blog for more on absorption rates). The overall days-on-market continues to decrease and currently sits at 91. The sales-to-list price ratio has also tightened to 97%.
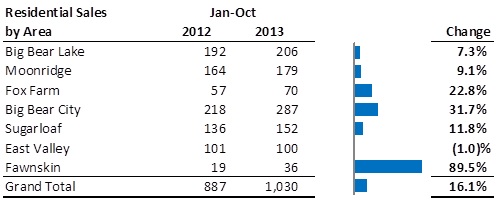
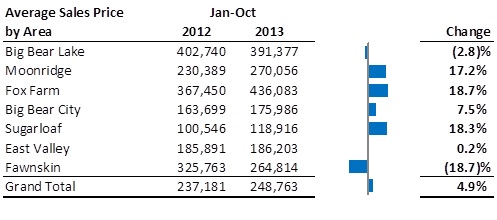
Year-to-date through October, the Big Bear real estate market overall has seen an impressive 16% increase in residential sales, with the areas of Fox Farm (+23%) and Big Bear City (+32%) contributing the lion’s share of this increase. Average prices have increased 5%, with Sugarloaf (+18%), Moonridge (+17%) and Fox Farm (+18%) showing the most appreciation. Furthermore, transactions in the price range between $250k - $500k continue to increase, up a whopping 53% from last year.
Big Bear Real Estate:
Residential Sales by Area

Big Bear Real Estate:
Average Sales Price

Supply Continues to Tighten
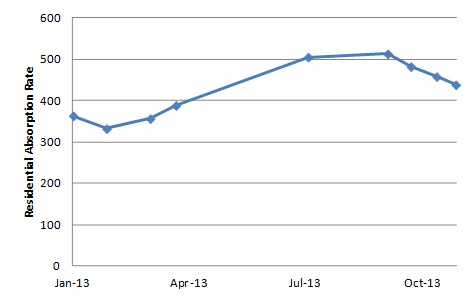
Residential Inventory in 2013

On the supply side, the inventory has diminished as there are currently 438 active residential listings on the Big Bear MLS vs. 513 at this time in September; inventory is down 17%. This equates to 4.3 month supply based on a 45 day closing period. The graph to the right shows inventory trends for 2013.
Of the current active inventory: 92% is resale, 2.5% short sale and only 1.8% foreclosures. Whereas, in looking at what is currently in-escrow, 84% are resale, 8% are short sale and 6.5% are foreclosures. 31% of what was sold year-to-date was purchased with cash. Also interesting to note, new construction is making a slight comeback with 9 sold so far this year and 14 listings currently on the market (as compared to virtually zero in recent years).
Interest rates have come back down recently and although there is not a ton to choose from, there are some very nice deals to be had. So let us know if you want info on the very best available that fit your specific criteria.
If you are interested in selling your Big Bear property, decreasing inventory and increasing prices makes it a great time to market. Do let me know if you would like to find what your home is worth in today’s market.
As always, thanks for your time and attention. We look forward to hearing from you and happy hunting.
