By Mike Sannes, May 11, 2015
Hello and thanks for checking in with us regarding the Big Bear real estate market. Here in Big Bear, they say never plant your flowers before Mothers’ Day. This year proves that saying correct once again, as we woke up to 3-4 inches of new snow yesterday (Friday 5/8.) Happy (perhaps belated when you ready this) Mother’s Day to all the Moms!
Big Bear Real Estate Market Showing Solid Momentum
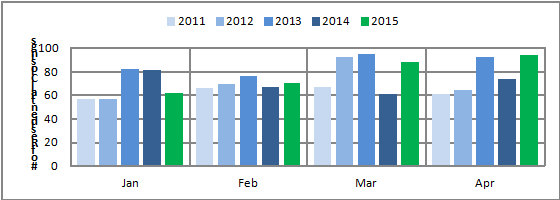
We have lots to catch up on, so let’s get right to it. The month of March put a cherry on top of what turned out to be a solid first quarter for the Big Bear real estate market. You may recall that January had most of the market watchers in Big Bear, myself included, scratching our heads as that month showed only 62 closed residential sales vs. 81 in January of 2014. After holding our collective breath, the activity in the market improved slightly in February with 70 sold vs. 67 in February 2014.
Then came March…
The market gained momentum in March and we saw an impressive 88 residential sales vs. 61 in March of 2014, a solid 44% improvement in sales over the same month last year. Important to note: this surge in demand proved not to be an anomaly, as in April there were 94 closings vs. 76 in April of 2014.
Monthly Residential Closings
Residential Sales by Area
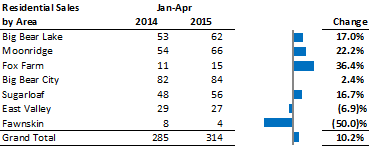
The Big Bear real estate market saw a 5.3% increase in total transactions in Q1 of 2015 vs. Q1 of 2014. However, if you include April’s impressive results, which we can as it is already May, then the market saw an impressive 10.2% increase in closed residential sales year-to-date (Jan-April) vs. the same period in 2014.
The areas that outperformed the market most were:
- Moonridge (+22% in sales: 66 sold Jan-April this year vs. 54 same period last year);
- Big Bear Lake (+17%, 62 vs. 53); and
- Fox Farm (+36%, although the difference here was 15 sold this year vs. 11 in 2014…not as large of an area.)
Residential Sales by Price Range
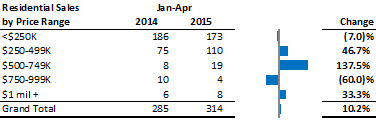
In addition to the different areas, an important trend to acknowledge has developed in the price ranges of those sold as well. In recent years, the growth in the Big Bear real estate market has been primarily in the $0 - $250,000 price range. This year however (again, January – April) sales in that price actually decreased 7%; whereas, in the price range of $250,000 - $500,000, there were 46.7% more transactions (110 in 2015 vs. 75 in 2014). Furthermore, in the price range between $500,000 - $750,000, we saw a whopping 137.5% increase in sales (albeit that equates to 19 this year vs. 8 last).
What effect has all this activity had on prices?
The market is definitely appreciating in the early part of 2015. The average sales price of all homes sold in all of Big Bear Valley (Jan-April 2015 vs. same period 2014) has increased 8.6% ($287,685 in 2015 vs. $264,913 in 2014). But this statistic, although a real number, reflects more of ‘what’ has been selling as opposed to simple appreciation. Meaning, has the average house in Big Bear really increased 2+% every month for 4 months straight? No, it hasn’t. The reality is that the increase in the number of sales in the higher price ranges mentioned above, has a lot (I would suggest at least half of the 8.6% total) to do with the overall increase in the average price we have seen year-to-date. The fact that significantly more ‘more expensive’ homes have sold so far this year than last, is largely responsible for this lift in average price. (Although prices are indeed on the rise.)
Supply is Strengthening
In addition to the strong demand evident a bit earlier in the selling season than we normally see, the supply side always plays a significant role in the market as well. At this moment in time we have 505 active residential listings on our Big Bear MLS. (Inventory is on the rise, typical for this time of year, as we had 407 listings in the middle of March, and 468 in the middle of April). The trend of more homes coming to market in the months to come is sure to continue and I would expect we will be will be in the 650+ range by mid-July.
As a buyer, this means more to choose from; as a seller, this means more competition. However the market so far this year has done a good job of absorbing this increase in inventory as there are 150 homes currently in escrow creating a robust 30% absorption rate. Based on a 45 day closing period, this equates to 5 months of inventory. (Whereas in March it was 3.8 months, in April 4.6 months…If you recall, 6 months is widely considered a ‘balanced’ market. 4 months or less defines a strong ‘sellers market’ and 8+ months, a strong ‘buyers market.’) Sellers still have a slight edge but we are quickly moving towards a more balanced market.
I apologize for the length of this update, I try to keep these under a page, but there was quite a bit to catch up on. If you are still reading, gratzi, and I hope you find this information useful. Let me end by pointing out that based on current market dynamics, it is a great time to list and sell here in Big Bear as demand is strong and although inventory is on the rise, there isn’t too much competition at the moment. This leads to a nice opportunity if you are considering a sale. If you would like more info on how it is we have consistently been able to deliver great results for sellers in today’s market, please do let me know. Or if you would like a specific and accurate assessment of the market value of your property here in Big Bear again, just let me know.
If you are interested in owing real estate in Big Bear and would like a hand-picked selection of the very best properties currently available that meet your specific criteria, again just let us know. We are happy to help and always look forward to hearing from you. Until next time, all the best and happy hunting!
Mike Sannes,
The Mike Sannes Real Estate Group