By Mike Sannes, June 18, 2016
Hello from beautiful Big Bear Lake and thanks for checking in with us regarding the Big Bear real estate market. Summer is here and, as the first half of 2016 has literally flown by, let’s get caught up on the happenings in Big Bear’s unique resort market.
Big Bear’s real estate market is primarily driven by vacation home and 2nd home buyers, but as with all markets, supply and demand certainly still influence price.
On the Supply Side
There are currently 563 active residential listings on the Big Bear MLS. This is a substantial increase in inventory from the 391 listings on the market in mid-March. This seasonal increase in supply, heading into the summer-selling-season, is to be expected. Inventory is roughly on-par with June of 2015, when we had 541 active listings.
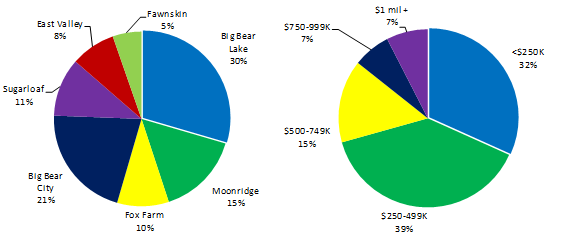
Active Residential Listings: June 2016
Based on the number of homes currently in escrow (179) and using the typical 45-day closing period, the current inventory level equates to 4.7 months of supply. Six months of supply is considered a “balanced” market; whereas, over 6 months of supply leans towards a “buyers’ market” and under 6 months of supply qualifies as a “sellers’ market.” I would describe the current market in Big Bear as stable and neutral -- not strongly favoring either buyers or sellers. However, based on the increasing demand we are beginning to see now that the days are growing longer and warmer, there are often more buyers for every well-priced home (as opposed to having more well-priced homes than we have buyers). Multiple-offer scenarios are beginning to occur more regularly in certain areas of Big Bear and in certain price ranges as well.
Looking at Demand
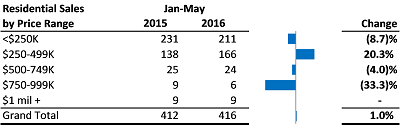
When looking at January through May of this year as compared to the same period in 2015, demand overall has been on-pace with last year. We have seen a 1.0% increase in residential closings (416 Jan-May of 2016 vs. 412 Jan-May 2015). March was the only outlier so far this year, showing a 27% increase in homes sold (113 in March 2016 vs. 89 in March 2015). While the overall market is relatively flat, there are some interesting dynamics worth highlighting.
Moonridge has seen significantly less sales (down 16%), while sales in Big Bear City (as opposed to Big Bear Lake) saw an impressive increase of 11.8%. Big Bear Lake, Fox Farm, Sugarloaf and the East Valley are all relatively stable, as compared to last year.
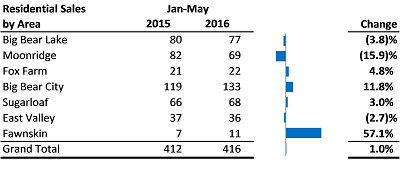
 The price range under $250,000 saw an 8.7% decrease in sales, which was surprising to me, although quality inventory is becoming more scarce. Sales in this price range however still make up 51% of all sales (vs. 56% last year.) The price range between $250,000 and $500,000 has shown strong growth, with an overall increase of 20.3% compared to 2015. Sales in this price range constitute 40% of all sales vs. 34% last year.
As Big Bear continues the slow and steady climb back from the bottom of the real estate market (3rd quarter 2011), price appreciation, albeit gradual, has become the norm. The average price of all homes sold in the Big Bear Valley from January-May of 2016 vs the same period of 2015, has increased by 3.7% overall:
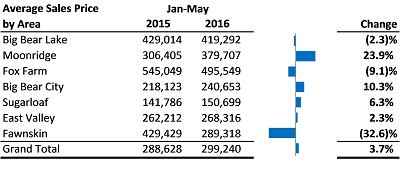
- Moonridge was up 24%, but, as there are not all that many closings specifically in Moonridge, having one or two high-end homes close distorts this number a great deal.
- Big Bear City was up 10% and made up the lion’s share of the overall rise in average home price.
I expect this trend to continue and for prices to remain stable and continue to gradually rise.
The wildcards in this scenario are, of course, the outcome of the upcoming election and what impact this will have on interest rate policy and the economy overall. Interest rates, however, remain at historically low levels and should hold throughout this year at least, with this being an election year. But what happens in 2017 and what effect this has on the economy is not yet ours to see. So, finding a nice deal on a great property and locking in an amazing rate this year looks to be a prudent move.
A few other market metrics to be aware of:
- The average days-on-market has declined 14% from 106 in May of 2015 to 91 in May 2016.
- The average sale-to-list-price ratio remains steady at 97%. It remains best to price competitively out of the gate and hold relatively firm, rather than to list too high and then reduce, as well-priced listings are selling very close to their asking price.
We hope you have found this information useful. We look forward to keeping you up-to-date on the real estate market in Big Bear. Should you have any questions regarding the market, or your home’s specific market value, please visit our website at www.realestate-bigbear.com. I am certain you will find our understanding of Big Bear’s unique resort market, our insight into the different areas of Big Bear and our knowledge of the local inventory very beneficial. We look forward to hearing from you -- contact us anytime!