June 2018 Market Update by Mike Sannes, Big Bear Real Estate - The Mike Sannes Team, June 15, 2018
Hello from Big Bear and thanks for checking in with us regarding Big Bear real estate. As we are already over five months into 2018, let’s dive right in and catch up on the happenings in the Big Bear real estate market.
The listing season is well underway and the number of homes for sale here in Big Bear has significantly increased since our last update. You’ll recall from our first-quarter update that the inventory, which typically declines in the winter months, dropped much more than usual this winter. In February of this year there were only 262 active residential listings; this is the lowest we have have seen since I began selling real estate here in Big Bear in 2004. However, by mid-April there were 364 active listings and currently there are 469 active residential listings on the Big Bear MLS. As expected, we have seen a substantial increase in supply as we head into summer.
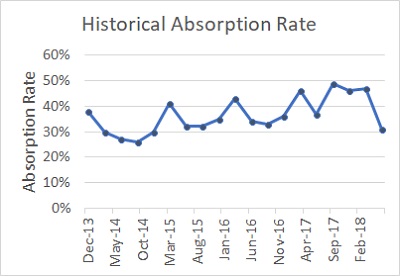 But as we know, markets are driven by both supply and demand. An informative market metric that illustrates both supply and demand is the absorption rate: The rate at which active listings are being absorbed (a.k.a. purchased) by the demand in the market. The absorption rate is often thought of as the "speed" of the market. For example, if we have 100 active listings with another 50 homes in-escrow, the absorption rate would be 50%. This would be akin to doing 100 mph in your car, as a 50% absorption rate in Big Bear is a very fast market, whereas 25% is quite slow.
With 469 active listings and 151 homes currently in-escrow (which equates to 4.7 months of supply), we currently have a 31% absorption rate in Big Bear. As the chart above illustrates, this is down notably as compared to the prior five quarters.
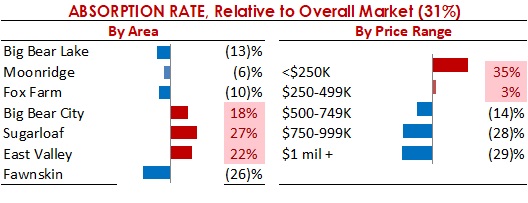
For you information, the charts below show the current absorption rates by area and by price range. Where the absorption rates are red, that indicates the speed is faster than the overall market. Where the absorption rates are blue, this indicates that the speed is slower than the overall market.
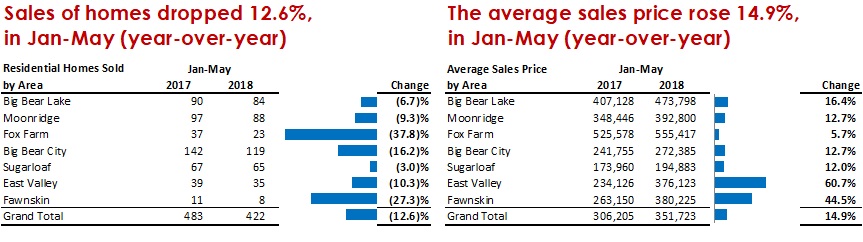
Also of note: When looking at the first five months of this year as compared to last, you’ll find that the number of closed residential transactions decreased by a sobering 12.6% (483 in 2017 vs 422 in 2018). The Fox Farm area took the brunt of the decline. However, the average price of all the residential homes sold during this same period, increased by a substantial 14.9% ($306,205 in 2017 vs. $351,723 in 2018).
As we head into the summer selling season here in Big Bear the market overall, so far at least, has been able to absorb all this new inventory at a respectable pace. But, with the significant decrease in the absorption rate from March to June, primarily caused by the dramatic rise in number of listings, it will be interesting to see if this will continue to be the case.
Stay tuned, and until next time, all the best and happy hunting. Please do let me know if you have questions on any homes you see for sale here in Big Bear, or your homes current value given the recent appreciation we have experienced. THANKS!