Uncategorized

Q2-2020 Market Update by Mike SannesBig Bear Real Estate - The Mike Sannes Team, July 25, 2020

Hello to you all and as always, thanks for checking in with us regarding the Big Bear real estate market. What an amazing few months it has been since my last update. Since the end of the first quarter in March, the Big Bear real estate market has been on an absolute roller coaster ride. And as these long days of summer keep flying right by, let’s take a minute and get caught up on how the COVID-19 pandemic has been affecting Big Bear’s unique vacation home market.

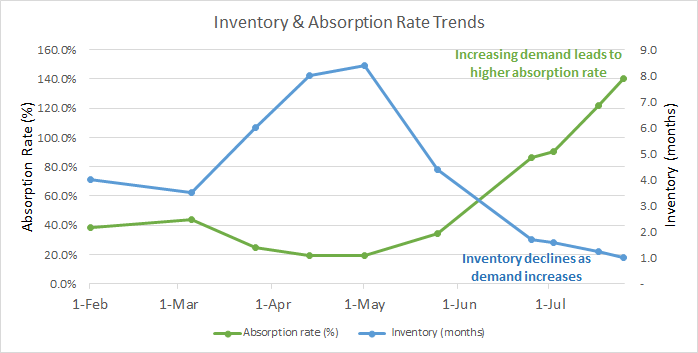
April, which is typically a slow month for sales here in Big Bear, started off as slower than molasses on a very cold day. On April 15th, we had 390 active listings and 74 homes in-escrow which translates to a 19% absorption rate* and equates to 8 months of inventory.** How bad was it? The total number of sales in April 2020 vs. April of 2019 was off by 58% (45 in 2020 vs. 108 in 2019) and was also off by 54% from the 5-year average number of closings (97) in the month of April.

These market conditions held through mid-May but by the end of May, a dramatic shift was underway with the absorption rate on the rise to 34% leading to only 4.4 months of inventory (394 active listings vs. 134 homes in-escrow.) Which for reference, is about where we were in February of 2020, prior to the pandemic taking effect.

As the chart below illustrates, this dramatic shift in demand -- which could aptly be described as a tidal wave of demand given the steep rise in the number of homes in-escrow -- continues to build. By the end of Q2 in June, we witnessed an unheard of 90% absorption rate and had under 2 months of inventory (308 Active listings vs. 270(!) in-escrow) -- truly unprecedented.

Absorption Rate & Inventory

What does this all mean for the real estate market here in Big Bear going forward? I have been selling real estate here in Big Bear since 2004 and, even in the hey-day of the bubble market in 2006, I have never witnessed there being substantially more properties in-escrow than there are active listings (312 in-escrow vs. 223 active currently). And in talking with a few old-timers that have been in this business here since the 80’s, this dynamic does indeed seem to be historically unprecedented. It is safe to say that the Big Bear real estate market has never seen anything even close to the level of demand we are currently experiencing and the reasons for this I think are many, including:

  • Big Bear’s affordability vs. down-the-hill pricing
  • A 3% fixed rate on 30-year mortgages
  • The move for many towards continuing to work remotely
  • The trend of not hopping on planes as the preferred method of travel
  • The increasing desire to be able to distance oneself from others, coupled with the social unrest many urban areas have recently experienced

The list goes on and only time will tell if the desire and ability of people to move to and live in more rural areas, father away from populated cities will continue. But in the meantime, it all adds up to increased demand for Big Bear: being a unique four-season alpine resort located within a 3-hour drive (or less) from roughly 20 million people, being a very popular destination and also as very attractive place to invest in real estate that can be used, enjoyed and perhaps vacation rented in order to offset expenses.

Please do let us know if you have any questions on the market overall or ANY properties that you see for sale here in Big Bear, as we have access to ALL listings and look forward to putting our local knowledge and expertise to work for you.

Until next time, happy hunting! If for any reason, you have considered selling your Big Bear property anytime in the last few years, opportunity is knocking as there are currently many more buyers than there are homes for sale. Juts let me know if you would like to understand the current value of your Big Bear property as we are happy to help and always look forward to hearing from you.

____________________

*Absorption Rate: The number of homes in-escrow / the number of active listings. Which shows the percentage of the inventory that gets ‘absorbed’ (a.k.a. sold) in a given escrow period (typically 45 days) Considered the ‘speed of the market’. Historically in Big Bear 20% or less is a very slow market with weak demand. Whereas 50%, (where half of the active inventory is being sold in a 45 day period) or thereabouts is a very fast market with very strong demand.

**Months of Inventory: The time it would take, based on a typical 45-day closing period, for all the active listings on the market to sell, if there were no new listings. Four or less months is viewed as a strong “Sellers Market.” Six months is considered a balanced market and 8 months or more is considered a strong “Buyers market.”

Full-Year 2019 Market Update by Mike SannesBig Bear Real Estate - The Mike Sannes Team, February 7, 2020

Hello from Big Bear! Thanks for checking in with us regarding Big Bear’s unique real estate market. As the new year is already well underway, let’s get caught up on what has been happening in the Big Bear real estate market.

The Mike Sannes Real Estate TeamBut before we dive right in, I would like to give a huge THANKS to all our amazing clients. 2019 was another fantastic year for The Mike Sannes Real Estate Team with 96 closed sales and over 32 million in total production. None of it would be possible without the trust and confidence of our incredible clientele and for that we -- myself, Maureen Auer, Rose Holmstrom and Cynthia Mossman -- are truly grateful.

ALSO: We moved offices! We are now at RE/MAX in The Village at 626 Pine Knot Ave. We are very excited to be a part of the RE/MAX Big Bear family and are looking forward working in the heart of the busy Big Bear Village. We hope you’ll stop in and say hello next time you are out and about in Big Bear.  Now, let’s get back to our real estate update.

2019 was solid year for the Big Bear real estate market. We saw a total of 1,259 residential closings, which equates to a significant 9.7% increase from the 1,148 in 2018. As the chart to the right shows, the area of Fox Farm realized a notable 24.2% rise in sales (82 in 2019 vs. 66 in 2018) and Fawnskin was simply on fire, with a 55.2% surge. (Although the 45 closed in 2019 in Fawnskin vs. 29 in 2018 is still a relatively small part of the overall market, it is impressive nonetheless.) Sales in Sugarloaf, which had been on fire in recent years, cooled a bit posting only a 2.7% increase (which is -7% relative to the market).

2019 Quarterly change in sales price and number of transactions
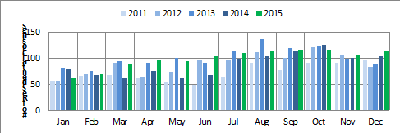
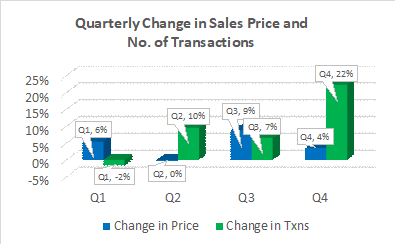
2019 ended with a bang, as the month of December saw an astounding 55% jump in closed sales! (119 in 2019 vs. 77 in 2018 and vs 105 in Nov. 2019) The chart to the left shows the Quarter-by-Quarter change in both average sales price and number of sales for 2019.

As you can see, prices in Big Bear showed improvement as well. The average price of all the homes sold in the Big Bear Valley in 2019 increased by 4.4%. ($352,654 in 2019 vs. $337,718 in 2018). While not jaw-dropping appreciation, it is certainly solid, stable and sustainable growth. Slow and steady has really been the story in Big Bear throughout the recovery, as qualifying for a loan to purchase a vacation home, for very good reasons, certainly isn’t as easy as it was in 2006.

At the peak, in early 2007, the average price in Big Bear was $400,100. By the end of 2011 it was $224,266, which equates to roughly a 79% decline. From the bottom, towards the end of 2011, to where we are now ($352,654) we have seen an encouraging 57% increase. However, unlike many areas in Southern California, Big Bear still has another 21% to go to reach the peak seen in 2007 which offers significant upside potential. In addition, as the economy continues to boom, interest rates remain historically low (30 yr. fixed-rates at 3.75%). These factors combined with increasingly strong demand to own an alpine real estate investment that's close enough to home to use and enjoy often (and also rent, in order to offset expenses should you choose)  leads me to believe that it is  only a matter of time before the Big Bear market will approach those peaks once again. And this time, it won’t be primarily due to irresponsible lending practices.

Let’s finish up by taking a quick look at the supply side. As February gets underway, we have a total of 340 active residential listings in our Big Bear MLS (vs. 363 this time last year). Based on a typical 45-day escrow period and the number of properties currently in escrow (131) that equates to a 3.9 months’ supply. (Meaning it would take 3.9 months to sell all the current inventory, if no new listings came to market.) Six months of supply is considered a balanced market. Whereas seven to eight months leans towards a strong "Buyers’ Market" and 4 months or less describes a strong "Sellers’ Market." So, we are starting 2020 with an inventory driven "Seller’s Market." This is important to understand as, although there are not quite as many buyers looking at cabins on weekends in February as there will be in July, the current lack of quality competition makes now a good time to act if you have been considering selling your Big Bear property this year. Contact me if you would like an accurate, current market value on your Big Bear property (as in Big Bear’s unique resort market, most of the zestimates I see are notoriously incorrect).  And do also let us know if you have any questions on any properties you see for sale here Big Bear as well. We are happy to help and always look forward to hearing from you. Until next time, all the best and happy hunting.

Q3 2019 Market Update by Mike SannesBig Bear Real Estate - The Mike Sannes Team, October 10, 2019

Hello From Big Bear!  Thanks for checking in with us. Let’s get caught up on the happenings in the Big Bear real estate market…

The third quarter, which is typically a very busy three months for sales and closings, did not disappoint in 2019. The average price of all homes sold in the third quarter of 2019 vs. the same period in 2018 increased by a solid 9% ($317,485 in 2018 vs. $345,632 in 2019)

In addition to prices being on the rise in Q3, the total number of sales was also up by an impressive 7% (322 in 2018 vs. 343 in 2019) which bodes well for a strong finish to a busy year for Big Bear real estate.

Interestingly enough, when looking at the market year-to-date (January through September 2019 vs. 2018), the average price of all homes sold in the Big Bear Valley and also the total number of homes sold, increased by 4.6% and 5.2% respectively. A solid, steady and hopefully sustainable pace for the market overall.Q3 2019 Sales By Area

Big Bear Lake proper contributed to the lion’s share of these price gains, increasing by a substantial 15.8%. Whereas it was the Fox Farm, Big Bear City and Fawnskin areas that helped bolster the total number of sales, as those areas saw a 16.7%, 14.9% and 38.1% increase in closings, respectively.

Q3 2019 Sales by Price Range
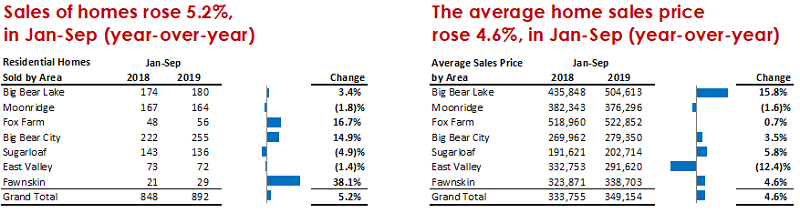
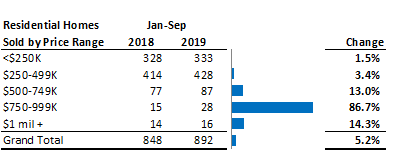
The biggest surprise, when looking at the distribution of sales by price range, has been between $750,000 and $999,000. In the first 9 months of 2019, closings in this price range were up an amazing 86.7%! (15 in 2018 vs. 28 in 2019) Wow, quite a few happy sellers in that group!  And it is encouraging to see, as this is a price range that has been very slow to sell in recent years.

What does all this say about how the year will finish? We will keep an eye on the market and keep you posted. In the meantime, do let us know if you have questions on your property’s current value in our appreciating market, or on any that you see for sale here in Big Bear. We are happy to help and always look forward to hearing from you. Until next time, all the best and happy hunting.

May 2019 Market Update by Mike SannesBig Bear Real Estate - The Mike Sannes Team, July 5, 2019

Hello From Big Bear!

I hope the summer has been treating you well. The weather could not be better here in Big Bear (finally!) Here's a quick summary of what’s been happening in Big Bear real estate so far this year, as of the end of May.

Sales by Area, May 2019
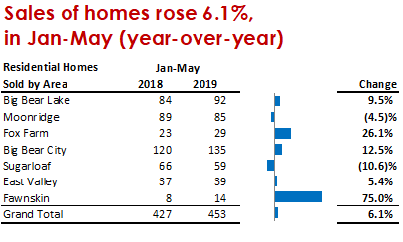
There has been an impressive 6.1% increase in transactions (Jan - May 2019 vs same period of 2018). Low interest rates are strengthening demand and should continue to do so for at least the remainder of this year. (April, typically a slow month for sales here in Big Bear, saw a whopping 46% increase in transactions:  74 in 2018 vs 108 in 2019.) ...continue reading

June 2018 Market Update by Mike SannesBig Bear Real Estate - The Mike Sannes Team, June 15, 2018

Hello from Big Bear and thanks for checking in with us regarding Big Bear real estate. As we are already over five months into 2018, let’s dive right in and catch up on the happenings in the Big Bear real estate market.

The listing season is well underway and the number of homes for sale here in Big Bear has significantly increased since our last update. You’ll recall from our first-quarter update that the inventory, which typically declines in the winter months, dropped much more than usual this winter. In February of this year there were only 262 active residential listings; this is the lowest we have have seen since I began selling real estate here in Big Bear in 2004. However, by mid-April there were 364 active listings and currently there are 469 active residential listings on the Big Bear MLS. As expected, we have seen a substantial increase in supply as we head into summer. ...continue reading

By Mike Sannes, Big Bear Real Estate - The Mike Sannes Team, October 9, 2016

Thanks for checking in with us regarding the Big Bear real estate market. Let’s get right to it.

The 3rd quarter of 2016 is now in the books, so let’s take a look at the current "state of the market" as we prepare to slide into winter. There are currently 527 active residential listings on our Big Bear MLS and, as there are 197 homes currently in escrow, that equates to 4 months of inventory based on a typical 45 day closing.

My How Times Have Changed

The days of the ‘distressed market’ in Big Bear have passed: only 1.3% of our active inventory is ...continue reading

By Mike Sannes, March 10, 2016

Thanks for checking in with us regarding the Big Bear real estate market. Let’s take a look at the start of 2016.

Residential Sales by Area
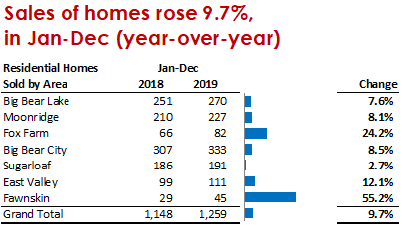
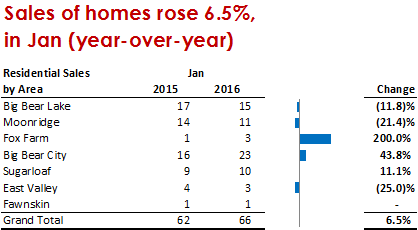
Residential sales in Big Bear jumped 3.2% in January compared with the same month a year earlier, and 6.5% year-over-year. A boost in sales in Big Bear City (up 43.8% compared to January 2015) contributed the bulk of this increase. In January, 66 homes closed escrow up from 62 in January of 2015. However, January 2016 sales are down 43% from December 2015, when 115 homes closed escrow. That said, it is typical for sales to slow in the winter months here in Big Bear. ...continue reading

By Mike Sannes, February 26, 2016

As 2016 is now well underway, let’s catch up on what transpired in the Big Bear real estate market last year and what that tells us about what to expect for 2016.

Big Bear Real Estate - Monthly Residential Sales
Monthly Residential Sales in Big Bear Valley

The real estate market in Big Bear fared well in 2015. We saw a surge in demand as, aside from January and October, every month of 2015 saw more residential closed sales than the same month a year prior.

...continue reading

By Mike Sannes, March 18, 2015

Hello and thanks for checking in with us regarding the the Big Bear real estate market. The beginning of a new year is always an interesting time for Big Bear real estate. How we start the year often lends insight into where we might finish and what to expect in between.

A Tale of Two Months

This year started as a tale of two months in stark contrast. The Big Bear real estate market finished strong in 2014. The average price of homes in Big Bear was up 9.8% last year compared to 2013 (The number of closed sales, however, was off by 13.7%.) ...continue reading