By Mike Sannes, September 11, 2015
Once again it seems the long days of summer have passed us quickly by. I hope the season has been full of fun for you! As it is well past time we got caught up on the happenings in the Big Bear real estate market, let’s get right to it.
The story in the Big Bear real estate market so far this year has been the increase in number of sales:
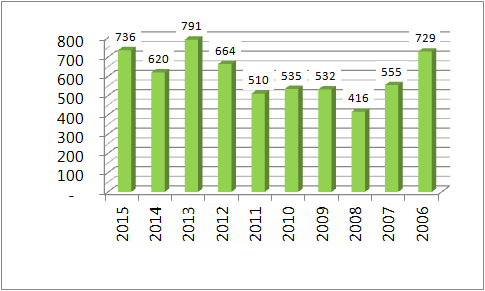
- Through August, the number of residential homes sold here in Big Bear increased a solid 18.7% as compared to the same time period last year (736 closed Jan-August 2015 vs. 620 for that period in 2014)
- In fact, as you will see in the bar graph below, over the last 10 years there has only been one other year, 2013, that exceeded this year's number of closed sales through August.
Historical Residential Closings, January through August
To what can we attribute such a substantial increase in demand? It looks to be a combination of several favorable circumstances:
- Long term interest rates remain at historically low levels.
- The increase in consumer confidence and confidence in the general direction of the economy overall is helping fuel demand.
- With Big Bear primarily being a vacation home market, wage growth and job stability in the Southern California’s metropolitan areas certainly helps our market.
- In addition, Mammoth’s Mountain purchase of our two local ski resorts last year, and the growth opportunities for Big Bear’s economy this investment should provide, has piqued interest in real estate here in Big Bear.
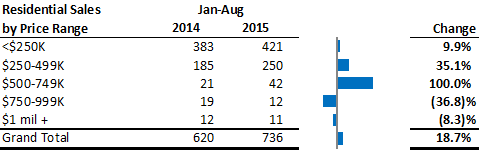
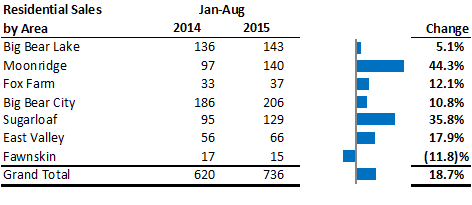
Let’s take a look at how this 18.7% increase in sales has been distributed throughout the different areas and prices ranges. As you will see below, the biggest beneficiaries here are:
- The price range between $250k - $500k (35% increase: 185 closed in 2014 vs. 250 in 2015) and also in the price range between $500k – $750k (100% increase: 21 in 2014 vs. 42 in 2015)
- The areas of Sugarloaf (35.8% increase: 95 closed in 2014 vs. 129 in 2015) and Moonridge (44.3% rise: 97 closed in 2014 vs. 140 closed in 2015) have also seen substantial increases in residential transactions.
I am sure you are wondering – What effect has this dramatic increase in sales had on prices? Through August as compared to last year, prices in Big Bear have been generally flat. In fact, the average price on residential real estate in Big Bear Jan-August this year is up only 0.4% It could be argued that prices remaining stable has had quite a bit to do with the rise in sales we have seen.
The good news here is that the Big Bear real estate market has held on to the respectable 9.8% increase in average price we saw in 2014. It is interesting, and not quite as I would have anticipated, how this played out. At the end of the 1st quarter (as compared to Q1 of 2014) the average price in Big Bear was up a whopping 11.6%. But by the end of the 2nd quarter, that increase was only 1.2%. A similar pattern of appreciation occurred last year, where the first part of the year attributed the lion's share of the increase we saw for all of 2014. This year however the market has given back those Q1 gains and we are now back to where we started this year from an average price perspective.
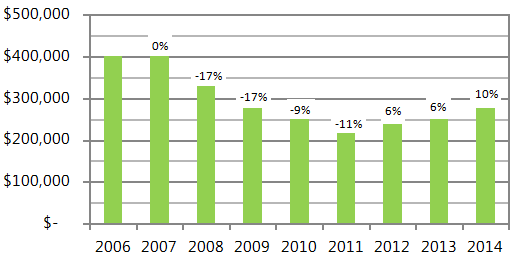
We have a few weeks left in September to see where the 3rd quarter ends up, but it looks to me as though the real estate market in Big Bear will be trading sideways for the remainder of 2015. Stay tuned for the results on this and for some perspective in the meantime: Below is a bar graph representing average price appreciation in the residential real estate market here in Big Bear from ‘the bottom’ which occurred in the 3rd quarter of 2011.
Average Sales Price and Change in Price
A couple other market metrics to keep an eye on:
- The average days on market this year has increased 18.2% (from 93 to 110).
- The average sale to list price ratio is holding right at 97%.
- The inventory, based on a 45 day closing period, is holding steady at five months supply (which equates to a relatively balanced market, as opposed to a strong buyers’ or strong sellers’ market).
- Cash closings represent 25% of our sales (down from almost 35% in 2010) and foreclosures represent only 4% of the closings this year (down from 14% in 2009)
Please keep in mind that we know Big Bear’s unique resort market very well and have access to ALL that is for sale here in Big Bear. Just give us a call or send an email in order to find out more about anything you see for sale here. Also, if you would like, we can keep you posted on the very best deals as soon as they hit the market, in order to keep you one step ahead of other buyers.
If you are considering selling, our listings are selling faster and for more money on average than the overall market and we would very much look forward to helping you obtain a fantastic result as well.
Thanks for checking in with us on the Big Bear real estate market and until next time: Happy hunting! And, keep your fingers crossed regarding this El Niño event we have been hearing so much about, as we are due and very much in need of a very wet fall and winter here in Big Bear.
Mike Sannes,
The Mike Sannes Real Estate Group