Thanks for checking in with the Big Bear Real Estate market. Overall, January real estate sales in Big Bear for 2011 were quite comparable to what we saw in January of 2010. Although, this year there was a modest increase in residential closings, from 56 in January of last year to 61 residential closings this January. Of those that closed in the first month of this year, 35% were foreclosures, which is quite a big number when you take into consideration that only 5% of our active inventory is bank-owned. There are currently 652 active listings and 115 properties currently in escrow leading to a more balanced market supply of roughly six months of inventory.
We have been tracking the big bear real estate market and looking at the dramatic difference in demand in different price ranges. For example, of the 61 closings in January, 81% of those closed under $250,000. But I thought it might be insightful to also take a look at the different areas of Big Bear to see what has been going on geographically in the market as well.
Our MLS breaks down the entire Big Bear Valley, (which runs from the west, at the dam, to the east, of Baldwin Lake,) into areas which differ greatly in size and price. For example, in the City of Big Bear Lake proper there are five areas: Bear Lake West, Bear Lake Central, Bear Lake East, Moonridge and Fox Farm. These areas in turn also have sub-areas which can greatly affect the statistics. For example, if a few very large homes in Castle Glen sell in a given time period, the overall median price in Fox Farm will be skewed.
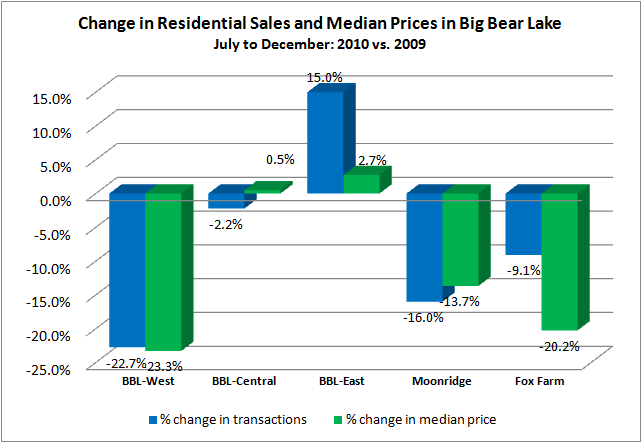
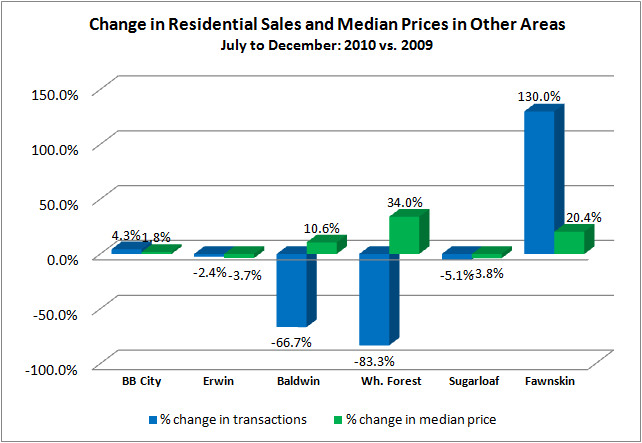
The charts below show the different areas of Big Bear Valley, with the percentage of the active inventory in order to gauge how large a part the area is of the overall market, followed by a look at the total number of residential sales and median prices of these sales in the last six months of 2010 as compared to the same time frame in 2009.
Let me know if you have any questions on anything for sale here in Big Bear. Until next time, all the best and happy hunting.
| Areas of Big Bear | & of inventory | July-Dec Sales 2009 | July-Dec Sales 2010 | % Change | Median Price 2009 | Median Price 2010 | % Change |
| Bear Lake West | 5.05% | 22 | 17 | -22.73% | $335,000 | $257,000 | -23.28% |
| Bear Lake Central | 11.31% | 45 | 44 | -2.22% | $230,000 | $231,150 | 0.50% |
| Bear Lake East | 9.33% | 40 | 46 | 15.00% | $365,000 | $375,000 | 2.74% |
| Moonridge | 18.65% | 100 | 84 | -16.00% | $265,750 | $229,450 | -13.66% |
| Fox Farm | 6.88% | 44 | 40 | -9.09% | $487,500 | $388,800 | -20.25% |
| Big Bear City | 19.27% | 117 | 122 | 4.27% | $154,000 | $156,712 | 1.76% |
| Erwin Lake | 6.27% | 41 | 40 | -2.44% | $121,000 | $116,500 | -3.72% |
| Baldwin Lake | 5.05% | 15 | 5 | -66.67% | $180,000 | $199,000 | 10.56% |
| Lake Williams | 1.22% | 1 | 3 | 200.00% | $164,000 | $249,900 | 52.38% |
| Whisp. Forest | 2.45% | 12 | 2 | -83.33% | $257,500 | $345,000 | 33.98% |
| Sugarloaf | 11.47% | 78 | 74 | -5.13% | $113,000 | $108,750 | -3.76% |
| Fawnskin | 3.06% | 10 | 23 | 130.00% | $215,950 | $260,000 | 20.40% |
| Total: | 100.00% | 525 | 500 | -4.76% | $207,000 | $200,000 | -3.38% |


