By Mike Sannes, February 5, 2014
January 2014 Market Update: Looking at 2013 Year-In-Review.
Hello and thanks for checking in with us regarding the state-of-affairs in the Big Bear real estate market. We diligently track and analyze Big Bear’s unique real estate market and our aim is to make this your one-stop-shop for all the latest Big Bear real estate information. Should the urge to buy or need to sell arise, we most certainly look forward, and are very able, to help you obtain a great result.
2013 was a solid year for the Big Bear real estate market. In the paragraphs to follow, I will update you on how the market fared with respect to price and number of sales, as well as cover some important market statistics that are worth keeping an eye on.
2013 Saw Home Prices Rise Across Most of the Big Bear Valley

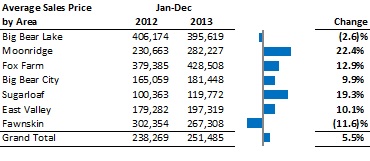
From a price perspective, we continued to see movement up and to the right in 2013. Overall, the average price paid for residential real estate in Big Bear increased a solid 5.5%, from $238,269 in 2012 to $251,485 in 2013. The 6.4% increase we saw in 2012 combined with the 5.5% increase last year adds up to a 12% increase in price since the Big Bear market bottomed out, from a price perspective, at the end of 2011. All-in-all not too shabby, but certainly not on pace with the whopping 20-25%+ increase many of the markets in Los Angeles, Orange County and San Diego experienced last year. Big Bear, being first and foremost a resort/vacation home market, tends to lag the owner-occupied/primary home markets in the urban areas down the hill. Hopefully, in 2014, we will continue to play catch-up with those markets. (I will have a January 2014 update ready for you soon…so check back for that...The Big Bear real estate market is off to a strong start in 2014.)
The distribution of the overall increase in price for the different areas of Big Bear varied: Moonridge saw an amazing 22.4% increase, Sugarloaf increased 19.3%, Fox Farm was up 12.9%, Big Bear City up 9.9%, whereas Big Bear Lake proper was relatively flat.
Number of Sales Up More Dramatically Than Price

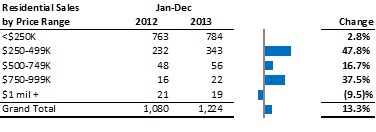
The total number of residential sales here in Big Bear increased 13.3%. Combined with the impressive 24.7% increase we saw in 2012 that brings the two-year total increase in residential sales here in Big Bear up an impressive 38%.
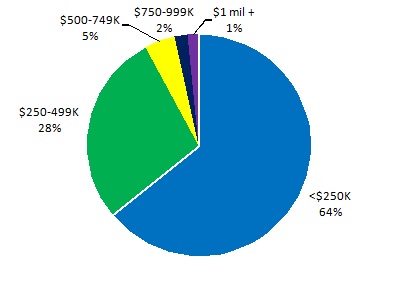
It is interesting to note that most of the money is still changing hands in the market under $250,000, with over 90% of the market changing hands at under $500,000.
- 64% of sales in 2013 were under $250,000
- 28% were between $250,000 and $500,000.
But the growth in the market is coming between $250,000 - $500,000 as sales in that price range increased a staggering 47.8% in 2013 from 2012 (That same price range increased 40% in 2012 so the number of deals in this bucket has almost doubled in the last two years.)
The following chart illustrates the 2013 breakdown by price range as well as highlights which areas were most responsible for 2013’s 13.3% increase in the total number of residential sales.
Residential Sales by Price Range: 2013 vs. 2012

Low Inventory and Increasing Demand Bode Well for 2014
Overall in the Big Bear real estate market we are still experiencing a low inventory – we have just over 4 months of supply vs. the 6 months that dictates a ‘balanced’ market – and increasing demand. This climate bodes well for the potential of appreciation to continue in 2014. The wildcards for any real estate market this year, Big Bear included, are the economy overall and most importantly, interest rates. Rates, although they did increase a bit in 2013, are still holding at historically low levels, making 2014 still a great time to buy a great piece of real estate in here Big Bear. As always we look forward to hearing from you and, until next time, happy hunting.
